

The standard definition: an ideal customer profile (ICP) is an account-level description of the companies you are best at winning, serving, retaining and expanding. It is a short list of firmographic and technographic criteria, plus
explicit disqualifiers, scored and tiered in the CRM.
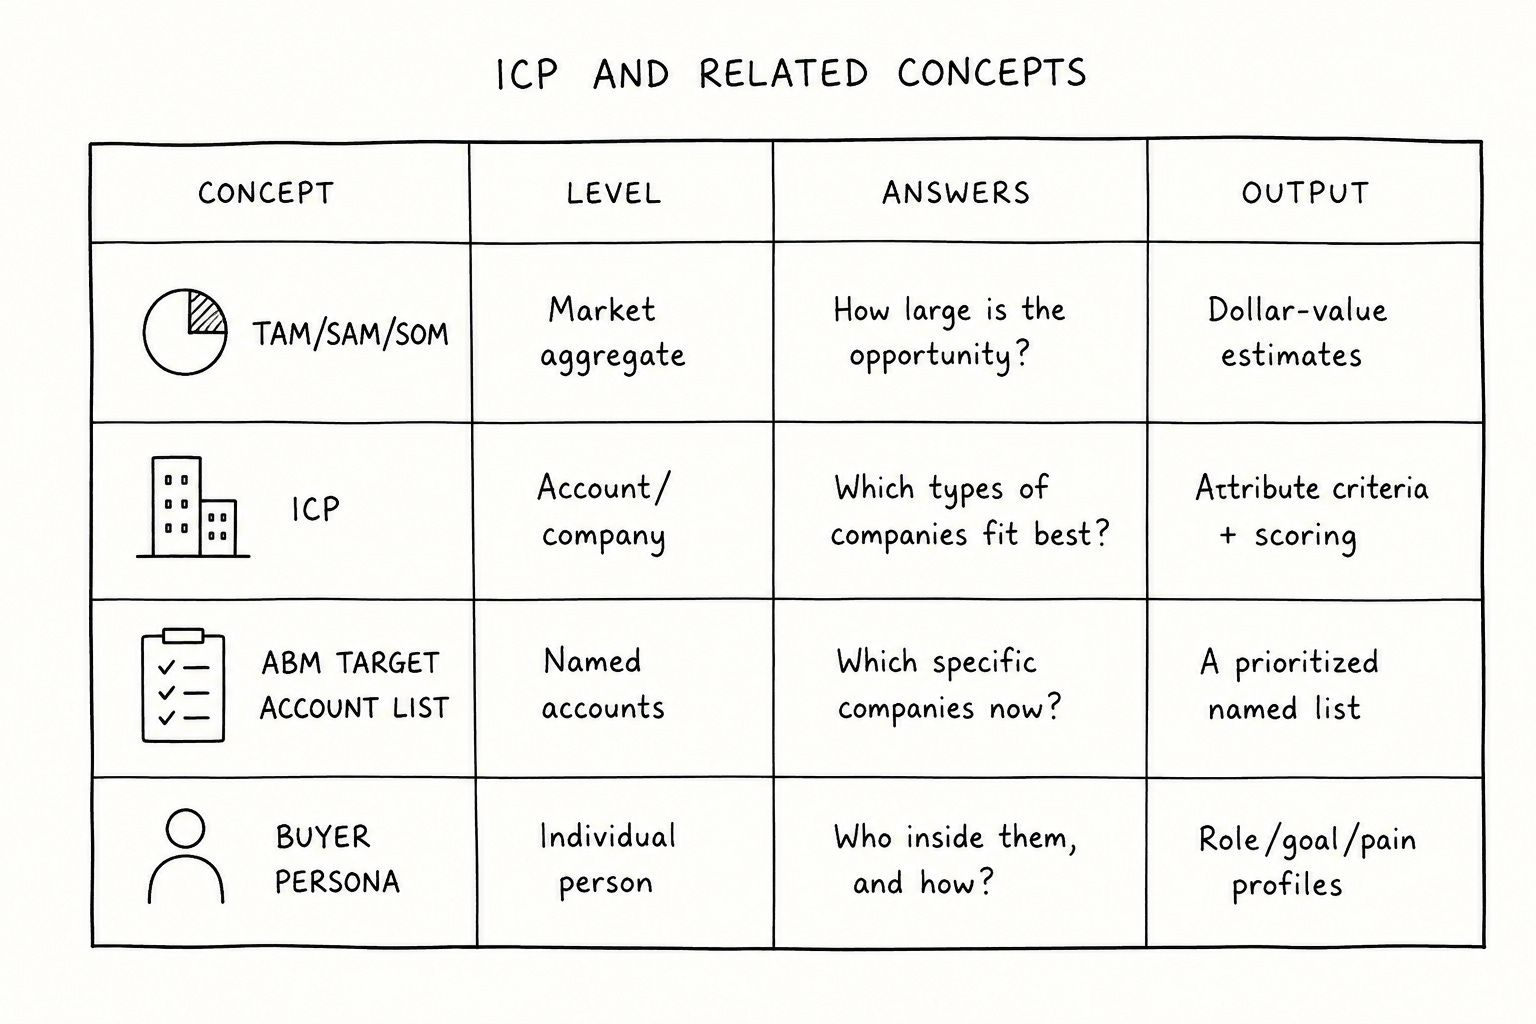
An ICP describes companies rather than people. A buyer persona is the person inside the account, TAM/SAM/SOM are market-size estimates in dollars, and an ABM target list is the named accounts you are working right now.
That definition is correct, and it produces some pretty useless docs. Sort your customers by industry and headcount and you get a profile that describes who they are while saying nothing about why they bought.
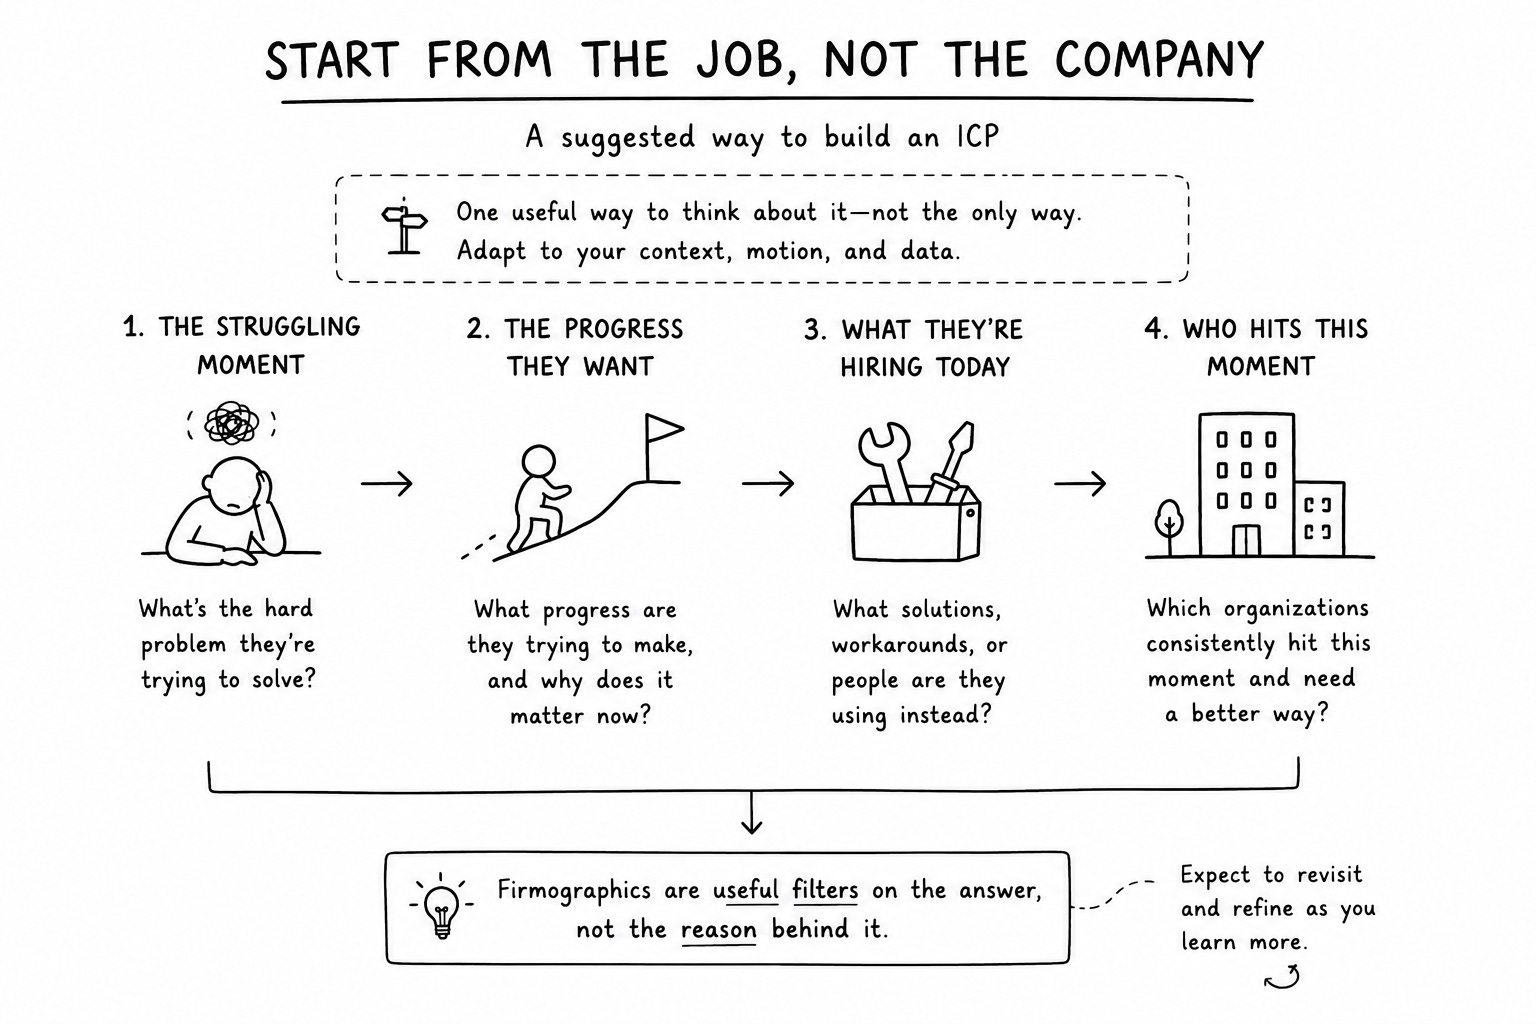
We wrote ours for the GrowthOS launch and now 2 months in revisited focused on the way round, starting from the job. Christensen: “The job, not the customer, is the fundamental unit of analysis.” Bob Moesta’s version changes what you do on a Tuesday: demand starts at a struggling moment and “it’s not an imagined customer or persona, it’s real buyers.”
So the first question is not what kind of company buys this. It is which organizations hit the struggling moment this product resolves, what progress they are trying to make, and what they are hiring today instead. Firmographics come back as filters on that answer, never as the explanation for it.
The other half of a real ICP is that it is enforceable: an SDR can disqualify an account against it, RevOps can score and route on it, and it gets reviewed monthly against closed-won data.
Revisiting our ICP
We wrote our ICP doc before GrowthOS launched in June 2026. It was a hypothesis with a template around it: which companies the platform would be structurally best at winning, extrapolated from work we had been doing for clients by hand. The first paid clients of the platform have since converted onto annual plans, which is the first evidence in the exercise that isn’t a guess, so we went back to the doc.
Before touching it, I created this study guide for myself, but I’m sharing it here since it might be a helpful resource.
A caveat on the numbers: they come from different years, samples and definitions, so several of them disagree. Use them as shape, not as truth.
Audio version
Here’s a computer generated audio version of this guide adapted for listening
What an ICP is, and what it isn’t (TAM, target lists, personas)
RevOps Co-op defines an ICP through four operational questions: who will buy, who will purchase smoothly and on time, who can be implemented and serviced, and who will renew, refer and expand.
Only the first is a sales question. An ICP built from “who signs” systematically overweights accounts that close and churn, which is why retention and expansion data belong in the derivation rather than in a CS dashboard.
The definitions worth having in front of you. HubSpot grounds it in data: an ICP is “based on company level firmographic and technographic data points (like employee size, technologies used, industry, and more).” First Round Review adds the temporal part: “a detailed description of the perfect customer (in the case of B2B, that means company)” and “a living definition that needs to be revisited frequently.” SaaStr raises the stakes: “Your ICP strategy is the basis for your entire company’s strategy.”
Four layers, four different questions:
TAM/SAM/SOM works at the market aggregate. How large is the opportunity? The output is a dollar figure.
The ICP works at the account level. Which types of companies fit best? The output is attribute criteria and a scoring model.
An ABM target account list works at the named-account level. Which specific companies are we pursuing now? The output is a prioritized list of names.
A buyer persona works at the individual level. Who inside those companies do we engage, and how? The output is a role, goal and pain profile.
The sequence runs: size the market, define ICP attributes, score the addressable universe, apply capacity and territory filters to get the named list, then map the buying committee with personas.
Clearbit draws the market-sizing line cleanly: “TAM, SAM, and SOM identify market potential and are represented by a dollar value. Your ICP takes that a step further and serves as a definition of the companies that are the best fit for your business.” Clay’s version: “every ICP account is in your TAM, but most TAM accounts are not in your ICP.”
On personas, HubSpot gives the operating split: “Think of your ICP as your pre-qualification filter and buyer personas as your personalization guide.” Forrester adds the complication that makes personas insufficient on their own: the same VP of HR can sit in several buying groups and play a different role in each. The five common roles are champion, influencer, decision-maker, user and ratifier.
An account can be a perfect ICP match and still sit outside the active target list on capacity or timing, which is why HubSpot’s ABM system tracks “target account” and “ICP tier” as two separate properties, Tier 1 being “a great fit” and Tier 3 “acceptable, but low priority.”
A fourth distinction is between ICP and IPP. Force Management draws the line “ideal customer profile does not necessarily equal ideal prospect profile.” A prestigious account can match the profile and still be a bad near-term prospect on stakeholder complexity or contract timing.
Jake Fuentes at Cascade gives the test for whether a candidate segment is real: “An ICP must be a single market segment: a group of people for whom the value of solving a problem is roughly the same, and who can be reached in roughly the same way.” Equal value and equal reachability, both necessary. OpenView arrives at the same test independently: a good segment “gets value in the same way and buys in the same way.”
Meka Asonye at First Round shows the difference between a vague segment and a usable one. Bad: “Series B technology companies.” Good: “companies who are experiencing X, who look like Y, who have previously tried these three solutions and need the product to do A, B, and C.”
Fit vs intent: why an ICP needs two scores
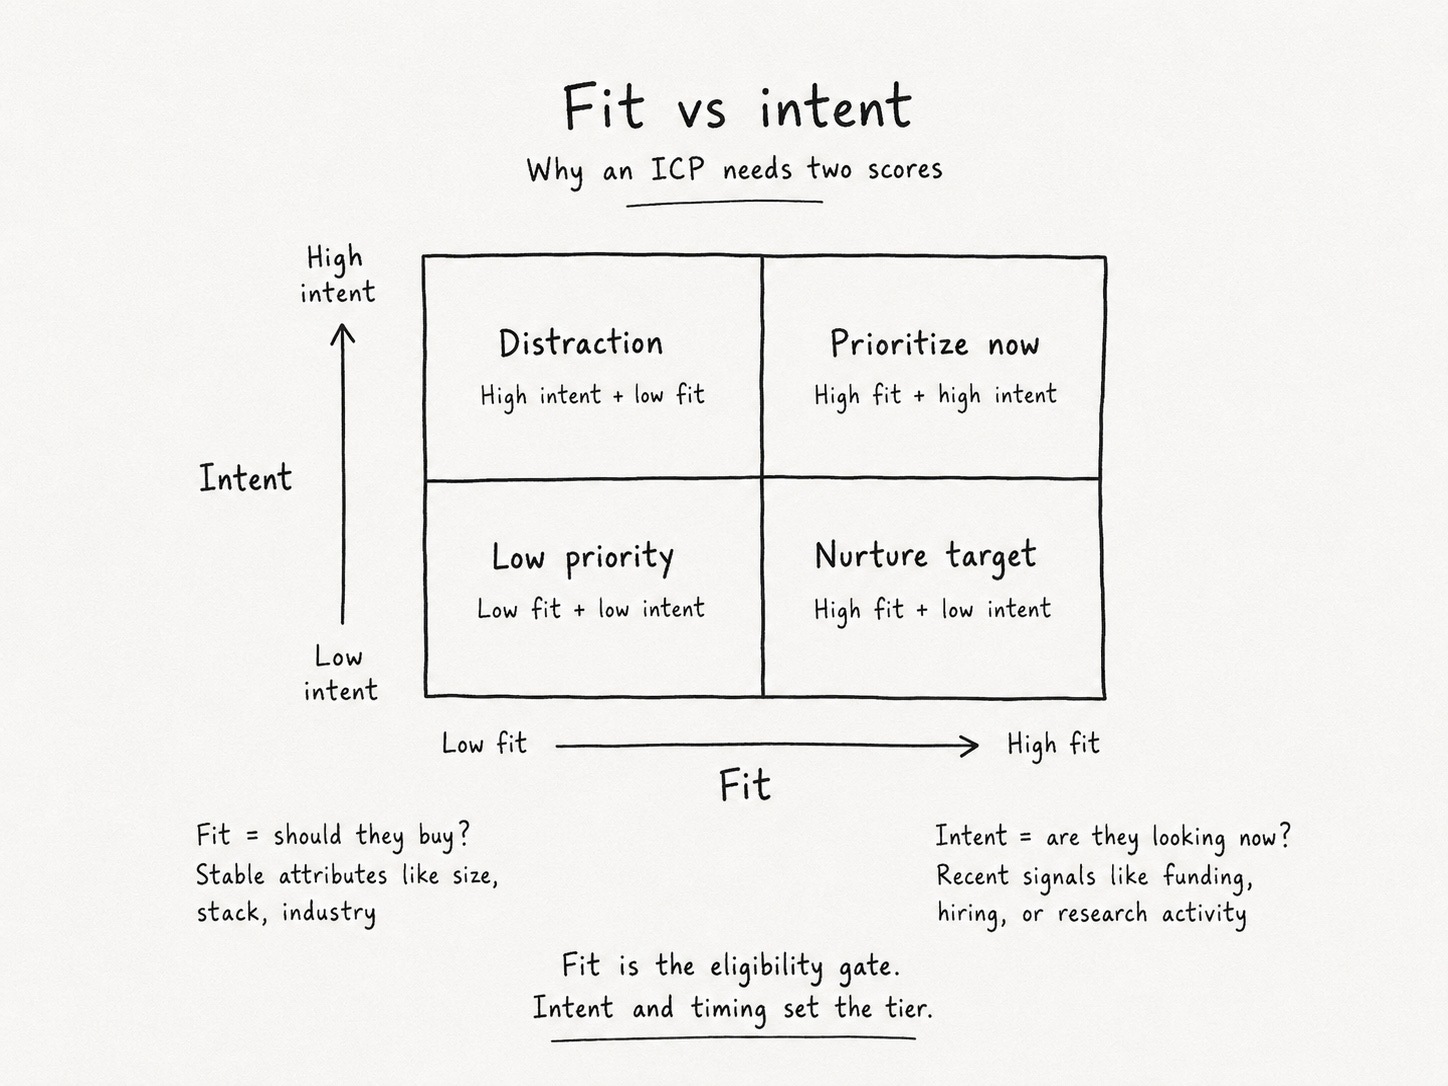
I’d install a fit-versus-intent model first. Clay defines fit as whether a company should buy from you, derived from stable attributes like size and stack. Intent is whether it’s looking right now, derived from recent signals like funding or hiring.
A high-fit, low-intent account is a nurture target. A high-intent, low-fit account is a distraction.
Score the two axes separately so you can treat them differently, then combine at routing. Fit is the eligibility gate; intent and timing set the tier. Bombora puts it from the data side: only a small portion of your ICP is in market at any time, and intent data exists “not to define your ICP, but to reveal which accounts are actively researching and should be prioritized now.”
The compelling event is why a static firmographic profile underperforms a signal-laden one. RevOps Masters reports its win/loss result: “The single most predictive factor in win/loss outcomes is whether the buyer had an identified event or deadline driving the purchase. Deals with a compelling event close at 3-4× the rate of those without one.”
Clearbit’s routing rule shows what combining the axes looks like in practice: “High-intent visitors should speak to sales right away if they have high fit. Low-intent visitors can be added to an ad retargeting campaign, email nurture sequence.” Their threshold example: an account that visited at least three relevant pages in a month, whose fit score qualified, got routed to the BDR team.
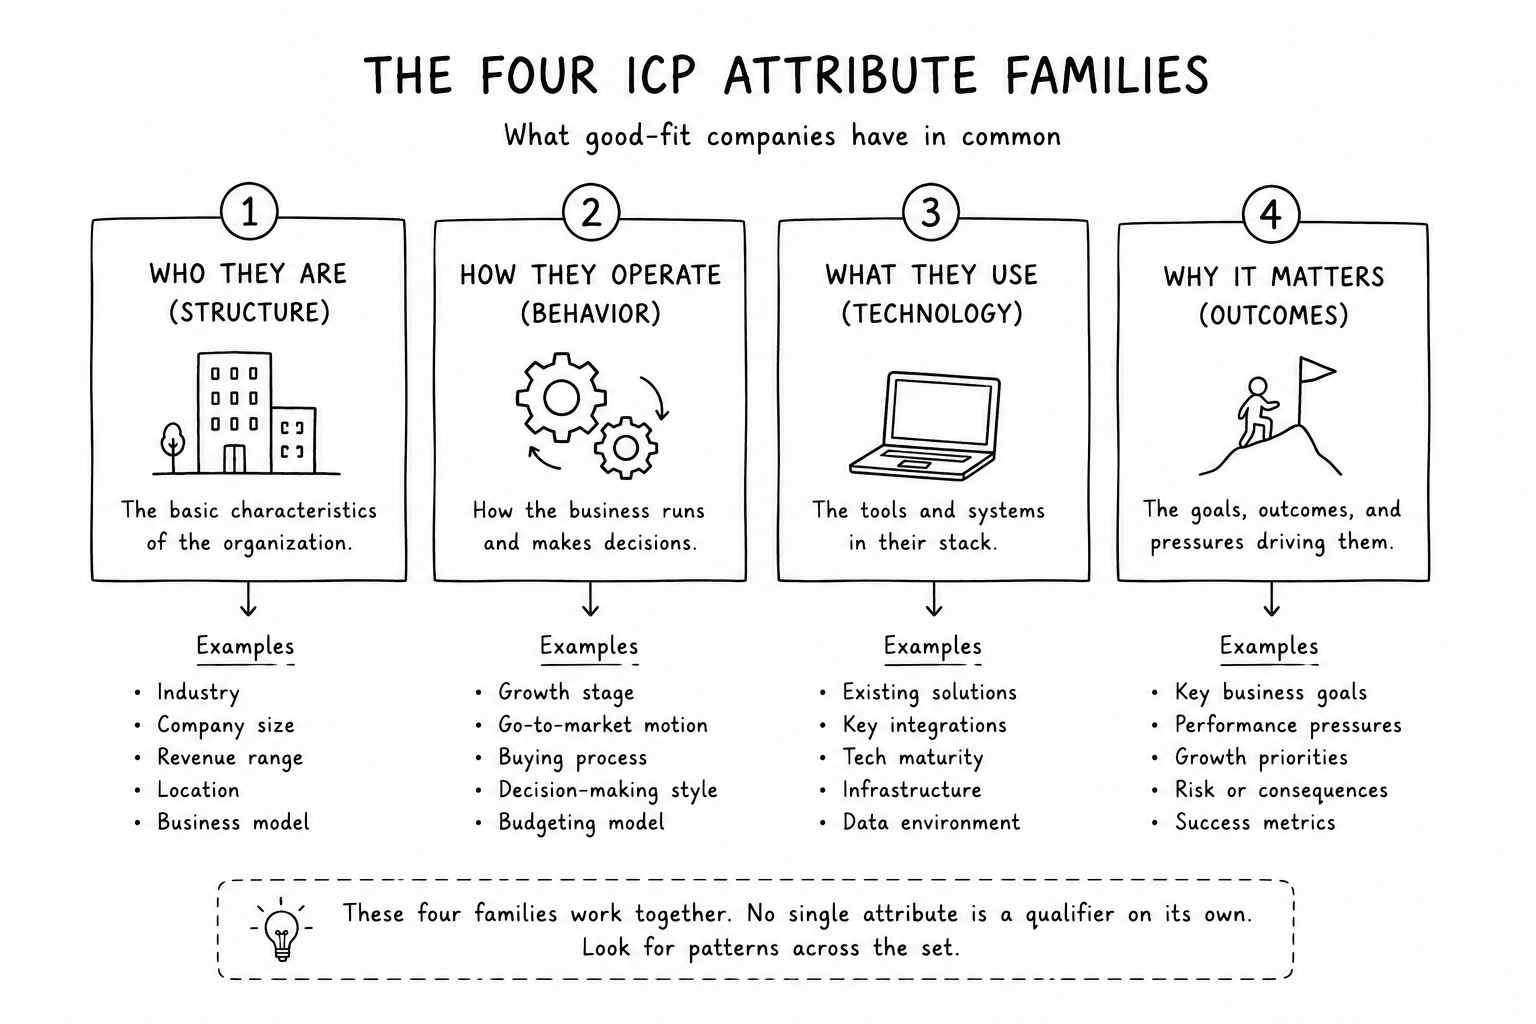
Which attributes belong in an ICP?
Four attribute families matter, and most bad ICPs stop at the first.
Firmographic. The standard set: industry, company size, revenue range, employee count, geography and business model, plus ownership type. Bessemer’s bands: Commercial 1-500 employees, Mid-market 501-1,000, Enterprise 1,000+, with revenue bands of $0-1M, $1.1-10M and $10.1M+.
Technographic. What they run: “which CRM they run, what marketing tools they rely on, where they host their infrastructure, and what sales platforms their reps use every day.” Two mid-market SaaS companies “might look identical on paper, but if one uses Salesforce with a modern tech stack and the other runs a legacy CRM with no API access, your approach should be completely different.” HG Insights goes further, measuring behind-the-firewall usage intensity and maturity, and separating Problem Aware, Solution Aware and Product Aware stages.
Behavioral. Buying signals: content consumption, website engagement, event attendance, search intent. What separates companies that fit your ICP in theory from ones actively buying. In product-led motions this is where PQLs live, converting at 15-30% on signals like usage frequency, adoption of high-value features, usage growth week over week, and multi-product usage.
Psychographic. How the organization decides. One list worth stealing covers “appetite for innovation, willingness to buy best-of-breed, attitude to vendors, decision-making style.” The pace difference matters too: “Some decisions require consensus across a large leadership team. Others sit with a single executive who acts quickly.” Lenny Rachitsky lists a company’s “way of working”, design-driven or operationally heavy, as an explicit field.
Prefer operational signals to generic firmographics wherever you can get them. First Round’s example is the cleanest illustration: instead of targeting companies with more than 500 employees, target “companies with more than 20 open, remote roles on LinkedIn. That’s a sharper ICP.” Same for pain: “It’s not enough to know the pain the prospect has, you want to deeply understand the impact of that pain.”
Bessemer’s five-factor needs framework, credited to Allyson Letteri, is the best short prompt list I’ve found for the situational half:
Pains: what pressing problems can your solution solve? Gains: what goals or desired outcomes drive your customer? Shifts: what company changes would make them open to new solutions? Blockers: what objections or misconceptions might hinder adoption? Motivators: what would urge them to move forward, ROI or testimonials or something else?
Shifts is the underused row. Common ones are “compliance mandates, a crisis or breach, new executives joining the team, or even when the team outgrows old systems.”
Product usage deserves its own note if you have a free tier. OpenView reports that Figma defined activation as “a user collaborates with other users in their first week” and modeled around 10 data points where “when two or more of these were triggered, there was a high likelihood for the account to upgrade.” A concrete multi-user trigger from the same playbook: when three or more users at the same company reach a high usage threshold, email the manager.
The jobs-to-be-done lens turns a tidy attribute list into a usable one. Tony Ulwick separates the job from the outcome, “a metric the customer uses to measure success”, which lets you cluster accounts by which desired outcomes are underserved and define segments that cut across industry and size bands. OpenView warns that conventional segmentation “can be severely deficient because it is an arbitrarily imposed view of the market,” and every criterion needs “a clear rationale as to why the particular criterion will impact or differentiate the needs or buying behavior of targets.”
Looker’s 2013-2015 ICP led with the job: “technical data teams, not end users or business analysts, who were starting to adopt cloud with large data sizes and complex analytical requirements AND the need to support a larger base of less technical end users.” Company size, 50-400 employees, appears only as a supporting filter and never as the explanation for demand.
How many attributes, and how narrow
Rachitsky collected the initial ICPs of more than a dozen B2B startups and found that “everyone landed on at least three attributes to describe their ICP. Some had more, but no one had fewer.” His instruction is to get “super-specific and super-narrow. Almost comically narrow.”
The receipts are the useful part:
Gusto started with companies of five or fewer employees, in California, offering no benefits, salaried employees only, no other deductions, and willing to be paid eight days after running payroll.
Gong picked three: selling in the US in English, selling via video conferencing, and selling software worth $1,000 to $100,000, “because beyond $100k, we assumed it was going to be a different sales cycle, and less than $1,000, it would be too transactional.” That left roughly 5,000 companies worldwide.
Snyk went depth-first: “a developer building with Node.js who was very security-conscious.”
Canva found theirs six months in, watching who got excited: social media managers and bloggers, “especially freelancers, who were building their own social media management business.”
At the other end, keep the filter to 4-7 attributes. More than 8-10 filtering dimensions and it is over-specified, fitting noise, and no longer usable by an SDR in real time.
Five frameworks for choosing a segment
Each framework contributes a different narrowing mechanism. You don’t need all five, but you should know which one you’re using.
In one line each: Moore picks the first segment by use-case urgency and reference community. Blank validates that a specific org type and buyer will actually purchase. Lean Analytics replaces aggregate counts with cohort metrics. MEDDPICC tests reality inside an account and aggregates into buyability patterns. Top-10 reverse engineering derives the profile from realized outcomes.
Moore. The transition that matters is early adopters to pragmatists who “want to see it proven out first, specifically in use cases that they themselves have and with customers they know and can reference.” A market is defined partly by reference behavior customers must “reference each other when making a buying decision.” Choose the first segment on problem severity rather than size,: “The size of the first pin is not the issue, but the economic value of the problem it fixes is. The more serious the problem, the faster the target niche will pull you out of the chasm.” The ICP has to encode the whole product, “the complete set of products and services needed to fulfill the compelling reason to buy,” which doubles as a test of whether you can actually serve the segment. Expansion then follows the bowling alley: target a connected segment that “by virtue of its other connections, creates an entry point into a larger segment.”
Blank. Customer Development runs discovery, validation, creation, company building. The earlyvangelist five criteria are the pre-ICP filter: “They have a problem. They understand they have a problem. They are actively searching for a solution and have a timetable for finding it. The problem is painful enough that they have cobbled together an interim solution. They have, or can quickly acquire, dollars to purchase the product.” He also advises going after companies that “aren’t the market leaders in their industries, but are fighting hard to get there,” then finding the internal evangelist who wants the competitive advantage. The validated sales model has to answer who influences, who recommends, who decides, who pays, where the budget sits, what acquisition costs, and how long a sale takes.
Lean Analytics. Cohort discipline instead of aggregate counts since “you can compare cohorts against one another to see if, on the whole, key metrics are getting better over time.” The OMTM is stage-dependent and temporary, and in interviews you “look for a subset of scores that spike; that’s your early-adopter customer segment.” Three cohorts, three questions: acquisition and win/loss (”can we get them?”), retention and GRR (”do they stay?”), expansion and NRR (”do they grow?”). The method needs an overfit warning: “if accounts that match your candidate ICP also churned at the highest rate, you have over-fit on a non-causal pattern and need to add an exclusion criterion.”
MEDDIC/MEDDPICC. Metrics, Economic buyer, Decision criteria, Decision process, Paper process, Identify pain, Champion, Competition, originally developed in 1996 by Dick Dunkel at PTC, with Paper Process and Competition added later. MEDDPICC contributes the feedback loop. Aggregate outcomes across won, lost, stalled and no-decision deals, tagged by account attributes, and you learn which characteristics predict buyability, cycle time and commercial success rather than theoretical fit.
Top-10 reverse engineering. Derive the profile from realized outcomes. SaaStr’s questions for your best deals: “How easy is it to close these top deals? How simple was it to set your customer up with onboarding and implementation? How sticky is your product?” A working version analyzes “10 to 20 best existing customers across revenue contribution, retention rate, sales cycle length, and product fit.” Allston Labs is the most rigorous: capture three layers per customer, “firmographic (who they are), behavioral (how they bought), and deal-shape (the buying committee that signed)... including the nulls, the distribution of nulls is itself a signal.” Weight the expansion cohort 3-5× because repeat purchase reveals organizational fit as well as product fit, treat closed-lost as “the empirical control group,” and note their headline claim: “the single highest-confidence ICP indicator is per-customer ACV growth at 12 months.”
How do you build an ICP from data?
Six analyses, in the order to run them.
1. Closed-won and closed-lost
Build a joinable dataset across six layers: opportunity, account, contact, source and campaign, product and use case, and post-sale retention. Separate new-logo, expansion and renewal cohorts before analyzing. Use a two-level loss taxonomy: primary as competitive, no decision, price and budget, or product gap; secondary as feature depth, integration ecosystem, implementation timeline.
Pull the last 12-24 months. No-decision outcomes are 25-40% of closed-lost deals on their own and should never be merged into competitor or price losses.
How much data you need before believing the pattern: 5-7 closed-won deals support a provisional hypothesis and nothing more, 30 closed-won is a stronger first-pass minimum, and 50 combined closed deals supports general win/loss pattern analysis.
Two behavioral signals worth pulling in the same query: hiring activity is associated with a 2.4× conversion lift, and funding events indicate a 3-6 month timing window. And triangulate rather than trusting one source: RevOps Masters recommends CRM loss reasons, rep debrief surveys and buyer interviews together, because rep-entered reasons measure perception.
A defensible scoring starting point, if you want one before you have enough data for a model: a 0-100 scorecard weighted firmographic fit 30, technographic fit 25, behavioral signals 25, deal potential 20.
2. Win rate and cycle length by segment
Never report blended. The example that makes it obvious: “A 24% aggregate win rate breaking down to 41% for SMB inbound and 9% for enterprise outbound tells you everything.”
The formulas, so the segmentation happens before the math: win rate by count is won deals divided by won plus comparable closed-lost, and sales velocity is opportunities × deal value × win rate ÷ cycle length. Segment by market size first, then calculate.
Across 4.2M opportunities at 530 companies and $54B of revenue, Ebsta and Pavilion found top performers had 42% shorter cycles, 76% higher ACV and 43% higher win rates than average. Early decision-maker involvement in the first two stages lifted win rates 55%, high-intent accounts closed at 3.4× velocity, and top performers were 24% more likely to disqualify non-ICP deals early. For orientation, average B2B win rates run 15-25% with mid-market cycles of 30-90 days, and lost deals take 2.0× longer than won ones.
One data-quality caveat before you trust any of your own numbers: Clari Labs, across 10M opportunities at 121 global enterprises, found 98% of companies fail to track closed-lost reasons consistently.
3. Unit economics by segment
Read gross-margin-adjusted CAC payback together with net dollar retention rather than alone, since a segment with short payback but poor retention is misleading. The formula: sales and marketing spend to acquire new customers ÷ (contracted new ARR × gross margin) × 12.
Bessemer grades it good at 12-18 months, better at 6-12, best at 0-6, with segment targets in favorable conditions of SMB under 12, mid-market under 18, enterprise under 24.
by target customer, as good (50th percentile) against great (80th): under 20 employees, 9 months against 2; SMB at 20-100 employees, 7 against 4; midmarket at 101-1,000, 14 against 7; enterprise above 1,000, 14 against 9.
KeyBanc’s 2024 survey puts fully-loaded payback at 25 months in 2022, 21 in 2023 and 20 estimated for 2024. These figures disagree because the years, samples, ARR scales and definitions differ. Shape, not truth.
4. Retention cohorts
GRR is the stickiness check, NRR the expansion check, and a strong NRR can hide widespread churn behind a few large expansions. The formulas: NRR includes expansion and reactivation and can exceed 100%; GRR excludes expansion and caps at 100%.
Benchmarks worth arguing with: Bessemer’s good/better/best is NRR 100/110/120%+ with logo retention above 85/90/95%; best-in-class B2B NRR sits at 110-125% with median monthly churn of 3.7% for $1-3M ARR companies; ICONIQ’s 2025 report has software NDR settling around 110-120%; and OpenView’s 2023 data shows PLG companies at 105% NDR against 98% for non-PLG.
The number that justifies the whole exercise, from OpenView: “annual retention rates can vary from 50% to 90% across different customer types for the same product.”
In Clearbit’s worked example, ~86% of long-term revenue came from ~18% of leads entering the funnel, and they narrowed the ICP accordingly.
5. Usage and time-to-value
Median SaaS activation is 30%, average 36%, and activated users should retain at 2× non-activated. For B2B, activation typically takes two to three weeks rather than minutes. Similarweb scores PQLs on two factors, ICP attributes (company size, role, use intent) and usage behavior (frequency and breadth), combining them to set engagement level and which product to sell.
Strong-fit usage looks like fast time to value, high activation against matched non-ICP cohorts, repeated use of the core workflow, adoption of the differentiating feature, multiple active users or departments, and usage rising over time.
Weak fit looks like signup without ever reaching the aha, shallow single-feature or one-off use, low account breadth, frequency declining after the trial, a high support and onboarding burden, and no expansion path.
6. Interviews
Quantitative data alone misses the mechanism, and there is a number for how badly. Clozd reports that buyer and seller reasons for closed-lost deals “only align 15% of the time, meaning 85% of CRM closed-lost data is potentially inaccurate,” and that roughly 70% of buyers name a different primary competitor than the CRM has. Surveys alone don’t fix it either: response rates in some B2B sectors run under 2%.
The thresholds worth knowing: five to eight conversations for a focused discovery sprint, ten similar deals as the minimum cohort to see patterns, and twenty within a segment before making a major strategic change.
Jason Sippey, formerly VP Product at Twitter, describes the progression: “After the first 10, you start to see patterns. After 20, you really understand segmentation of the market. After 30, you have a really good understanding of what you actually need to go build.” His four questions: do you have this problem, how are you solving it today, how much are you spending to solve it, how does it impact your business.
For loss interviews specifically, GTM Operations’ five questions are better than most scripts: what triggered the search, which vendors made the shortlist and what were the first impressions, rank the top three factors in the decision, was there a moment your opinion of us shifted, and what would have had to be different for the outcome to change.
Two discipline rules. Buyers should speak 90% of the time. And the payoff for keeping at it: companies running win-loss for two or more years report an 84% increase in win rate.
The same interviews give four qualitative signs that you are closing in on the right segment: a significant jump in conversion rate, a significant jump in enthusiasm, a much stronger desire to act now, and the nod.
Sequence: quantitative analysis to find anomalous or attractive cohorts, qualitative interviews to find the mechanism and the language, then a second quantitative test for prevalence and predictive power.
Working with a small sample
You will almost always be here first. The workflow with roughly 12 accounts: pull the top 3 by revenue and top 3 by NPS or NRR, find the shared attributes, and treat the result as a hypothesis you revise quarterly.
Then borrow four rules from Allston Labs: use closed-lost as the control group, since attributes that differ between won and lost carry the decision weight; compute a win/loss ratio per attribute, where something appearing in 70% of won and 30% of lost is high signal; weight expansion cohorts 3-5×; and run three to five structured interviews with your most engaged customers.
What should an ICP document include?
Assembled from James Doman-Pipe’s GTM Playbook template, Full Funnel’s ABM six pillars and HubSpot’s partner ICP worksheet.
Header. Name, owner, last updated, change log. HubSpot’s is the only one of the three with a change log, and skipping it is how a definition goes stale without anyone noticing.
Firmographics. Industry, employee count, revenue band, geography, business model, funding stage and growth rate.
Technographics. Current stack, competitive and complementary solutions in use, IT spend and digital maturity.
Situational fit. Pain signal, buying trigger, current solution, budget parameters. Doman-Pipe’s bar for a pain signal is observable rather than adjectival,: “Not ‘they have messy data’ but ‘their team is manually reconciling data from three tools every Monday morning and it is taking four hours.’ Specific and observable.”
Buying committee. Economic buyer and what they care about, champion and the pain they feel, influencers, blockers and insiders, and day-to-day users versus buyers.
Why we win here. Two or three outcomes delivered, plus the structural advantage in this segment. If you can’t name the advantage, this is a segment you can serve rather than one to commit to.
Disqualifiers. Their own section, not the inverse of the positive criteria.
CRM fields. Fit score 0-100 and ICP tier as properties on the company object, how we find them, owner, last review date.
Published templates worth copying
a16z’s nine fields: company size or revenue range, type of business, geography, industries served, job titles, a definable solvable problem, company-specific attributes, specific technologies used, unique buyer behaviors. With five diagnostic questions: which customers get the most out of the product, what traits do the best share, what objections recur in losses, who is easiest to upsell, and what do competitors’ customers have in common. Their worked example: “Large global retailers with onsite developer teams that use GitHub; have specific requirements for PII and customer data residence drive vendor decisions; and their cloud usage means they don’t have on premise requirements.”
Lenny’s nine fields: company size, job title, pain point being solved, company’s unique way of working, specific tech used, type of business, price point, geography, and a unique place the user spends time.
Bessemer’s Six Ps worksheet: Persona, Problem, Proposition, Product, Positioning, Promotion, with a bar for the persona section I like a lot: if all the criteria are met, the account should buy 80% of the time. Their worked example rejected universities as an ICP because “the higher education market is incredibly fragmented, insular, has restrictive budgets, and quite political,” and moved to residency teaching hospitals, clinics and paramedic schools.
Productboard’s seven dimensions: company size, product stage, digital-first or digital transformation, single or multiple products, size of the product organization, care for the customer, B2B or B2C. Which resolved to “an early stage, digital-first startup with strong customer-centric, product-led culture, with one product team, building a single (ideally) B2B product.”
HubSpot’s own 2024 NAM/EMEA ICP, which is rare in publishing its own numbers: 150+ employees, $100M-$500M revenue, software, IT and financial services, $4.6K average monthly deal size, 25% conversion rate, 75-90 day deal length.
Adam Schoenfeld’s paragraph format, for teams that won’t read a table: “We are best for B2B SaaS companies with 75-5,000 employees in the US and Canada. Our ideal customers are growing revenue with a sales-led motion, have 10+ AEs assigned to account-based territories, have sophisticated revenue operations...”
GTM Labs’ worked example is the one I’d hold up as the standard for specificity: 100-500 engineer companies on Kubernetes spending $5K+/month on Datadog, where a Senior SRE is the technical champion and the VP Engineering owns the budget, triggered by a Datadog renewal within 60 days.
The disqualifier section
A negative ICP is a distinct, named section. João Coelho treats them as separate architecture: “Disqualification criteria are not the inverse of ICP. They’re a separate architectural decision.”
Three exclusion types: hard (never target, such as a size floor or a country you cannot legally support), soft (target only with a different motion, such as enterprise logos needing field sales rather than cold email), and conditional (target only if a trigger overrides the default, such as a smaller company that just raised).
Concrete dimensions people actually write down: pre-revenue companies with no paid motion, or sub-200 employees when the deal size is too small; agencies reselling without their own list, or project-based engagements under $25K; a champion with no budget authority and no path to a decision-maker; missing core integrations; and a company eight months into a three-year contract with a direct competitor.
Then make it mechanical. A multi-signal routing rule: three or more negative signals auto-disqualifies, two routes to manual review, one proceeds but flags in the CRM. And the enforcement point that matters most: “Do not rely on rep discretion. Use CRM views, enrichment rules, and sequence entry criteria. If a segment is truly a negative ICP, the system should block it before it reaches a sender account.”
The CRO at Consensus built the positive version of this out of win-loss data and called it a UCP, an un-ideal customer profile: “We now know exactly what a bad prospect looks like,” which they tied to a more streamlined sales process and lower churn.
Who owns it, and where it lives
Two artifacts, not one. The narrative version lives in a shared doc: Full Funnel publishes a Google Sheet, HubSpot a PDF worksheet. The enforced version lives in the CRM as an ICP fit score (number, 0-100) and an ICP tier (dropdown: Tier 1, 2, 3, Not a fit) on the company object.
Ownership goes to RevOps where that function exists, “or if you don’t have RevOps yet, whoever manages the CRM and the go-to-market cadence.” Earlier than that it belongs to the founders because “when you’re super early, everything should still be sales-led. You’re still figuring out your ICP and personas, and that requires talking to customers.” When conversion is inconsistent rather than absent, product marketing is the better owner. HubSpot’s cadence: “review it every quarter using fresh CRM data, closed-won deal patterns, and updated customer feedback.”
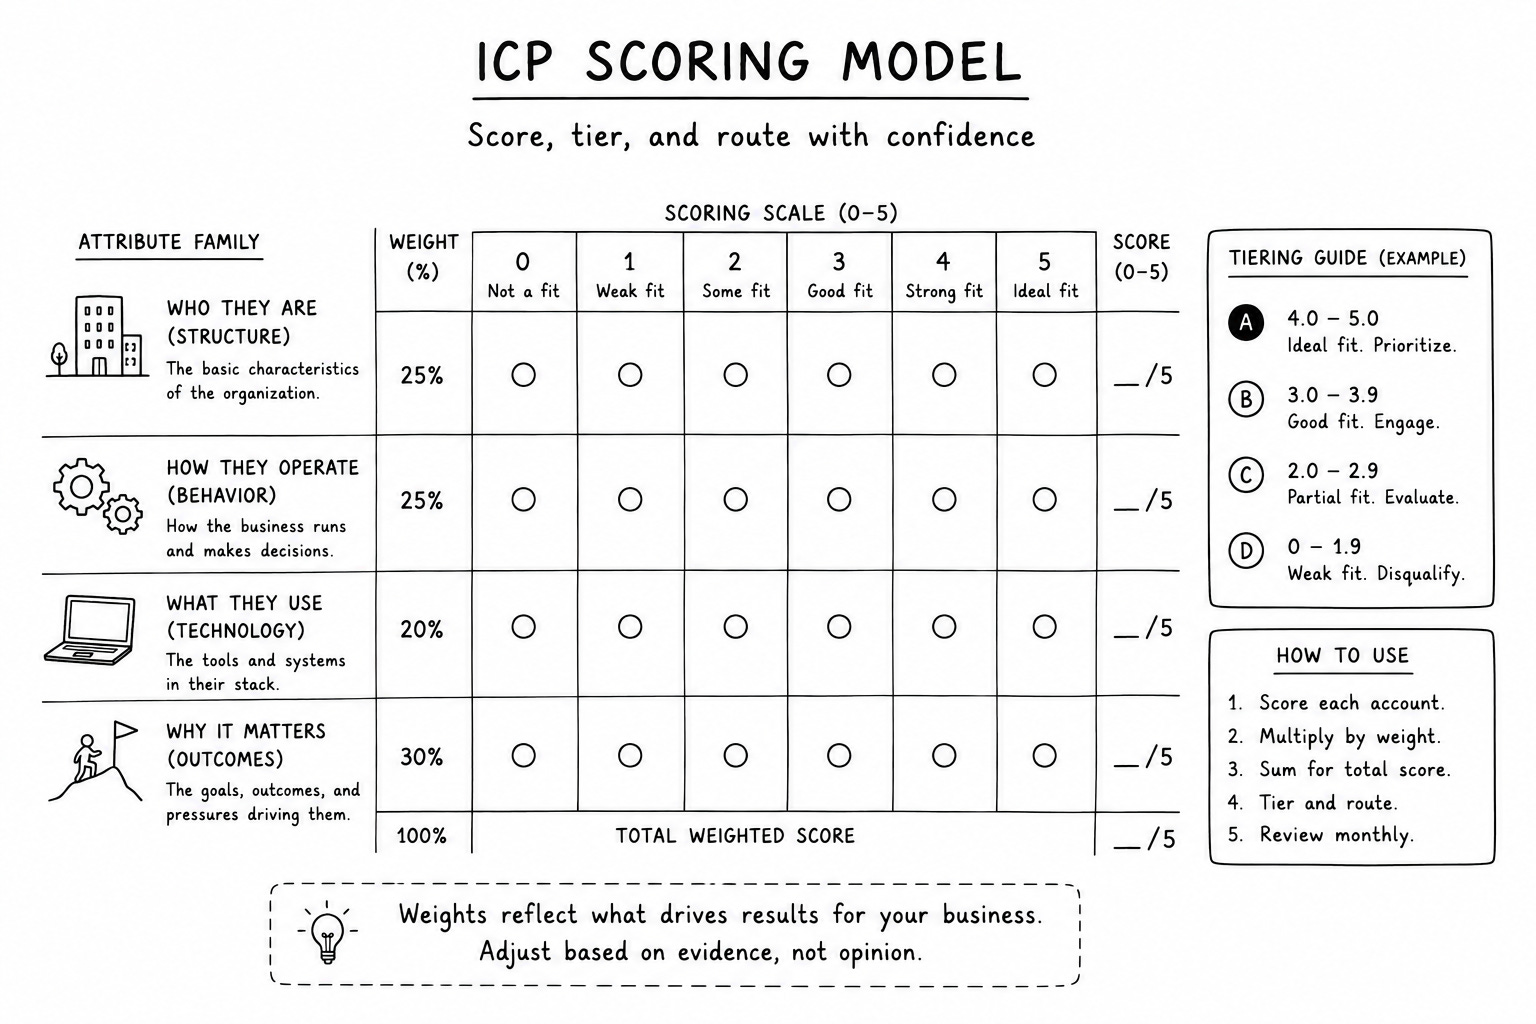
How do you score and tier accounts?
Four scoring models require progressively more data.
Weighted point-based, the simplest thing that works. 500+ employees +50, Director title +10, industry, country and technology 1-5 each, negative values for non-ICP attributes. Clearbit describes the progression from basic firmographic filtering to weighted points to predictive models, which is the order to walk it.
Weighted rubric. A two-layer model: industry 20, employee count 20, revenue band 15, tech-stack adjacency 15, geography 10, funding and growth 10, hiring 10, each scored 100/60/30/0 by band. Combined as Account Score =
(0.4 × Fit) + (0.6 × Intent), with intent recency multipliers of 1.0× for 0-30 days, 0.5× for 30-90, 0.1× beyond. A published variant weights firmographics 40%, technographics 25%, intent 20%, behavior 15%, with 70+ qualified, 50-69 worth working, under 50 disqualified. Another is industry 25%, size 20%, tech stack 15%, growth signals 15%, org maturity 10%, geography 10%, negative filters 5%.Decision-tree look-alike. MadKudu’s model uses firmographic, demographic and technographic data only for fit, with behavior in a separate Likelihood to Buy model recomputed several times daily and combined as
Lead Grade = 2× Fit + 1× LTB. Bands: Very Good 85-100, Good 70-84, Medium 50-69, Low 0-49. Validation targets: recall above 70%, precision as a 10× conversion ratio between top and bottom scores, rejection rate under 5% for top scores.Customer-specific predictive. 6sense trains a model per customer on firmographics, technographics and custom fields, and the model itself identifies which characteristics matter. Bands Strong 81-100, Moderate 50-80, Weak 0-49, updated daily.
Two rules apply across all four models. Hard disqualifiers stay binary: never let a high firmographic score buy its way past an exclusion. And if you have two or three segments with meaningfully different win criteria, build separate models, because blending obscures the signal.
Tiering
ICP fit is the eligibility gate; intent, timing and signal strength determine tier placement. Composite formulas exist if you want one: (ICP Fit × 0.30) + (Intent × 0.25) + (Engagement × 0.25) + (Revenue Potential × 0.20), or fit 30%, revenue potential 25%, intent 20%, engagement 15%, strategic value 10%.
What matters more is tying each tier to a motion and a volume rather than to enthusiasm:
Tier 1 is a perfect fit across all dimensions, $100K+ ACV in the worked example, 10-25 accounts per rep, custom outbound with exec engagement and ABM ads, five to eight touches a week, fully personalized.
Tier 2 is a strong fit with one or two minor mismatches, $25K-$100K, 25-50 accounts per rep, programmatic ABM with industry-segmented messaging, two or three touches a week, semi-personalized.
Tier 3 is a partial fit that clears the minimum, under $25K, 100+ accounts per rep, inbound and paid social and self-serve, one automated touch, templated.
For calibration, HubSpot runs Tier 1 at 20-50 accounts with “deep research and one-to-one customized outreach” and Tier 2 at roughly 200 with industry and persona personalization. ACV maps to load: 20-50 accounts per rep in field sales at $50K-$500K ACV, 50-150 in a two-stage motion at $10K-$50K. Mutiny shows what real separation looks like: Tier A converted lead-to-opportunity at 30%, Tier B at 8%, and Tiers C and D were “effectively rounding errors.” Oliver Jay started with 100 enterprise accounts at Asana and concluded “that’s too many. It should have been just 50.”
Tiers should move. Mosaic narrowed 100,000 accounts to 8,000 managed by nine BDRs, with accounts crossing tiers annually as funding, size, geography and stack change. One team re-tiered its entire customer base in three days on four signals (growth potential, AI maturity, engagement, account health), landing on 8 Tier A accounts and 21 Tier B.
Trigger events
Six categories, across 6sense, Bombora, ZoomInfo, Demandbase, Common Room and UserGems: capital and funding; leadership changes, where UserGems reports past champions “convert about 3x higher than normal leads”; hiring and job postings, which reveal strategic priorities; technology adoption or replacement, where HG Insights’ technographic flags produce up to a 5x conversion rate to opportunity; expansion news; and layoffs or contraction, which can indicate consolidation needs.
First-party intent has its own ladder, from Clearbit: high intent is pricing, SKU, trial and demo pages; medium is customer stories, solutions, partners and integrations; low is the homepage, about page and blog.
Measuring the ICP itself
Not just the accounts. ICP pipeline contribution as a share of opportunities by count and by dollars, win rate and deal velocity by tier, and renewal rate by tier.
Bessemer stages the reporting: “At $1M ARR it is common to look at total pipeline, but at $25-50M this pipeline should be segmented by ICP targets” and split new-logo from expansion. Coverage benchmarks to hold it against: 3-5× the ARR goal unweighted, 2×+ weighted in-period, and $8-10 of pipeline per $1 of marketing spend.
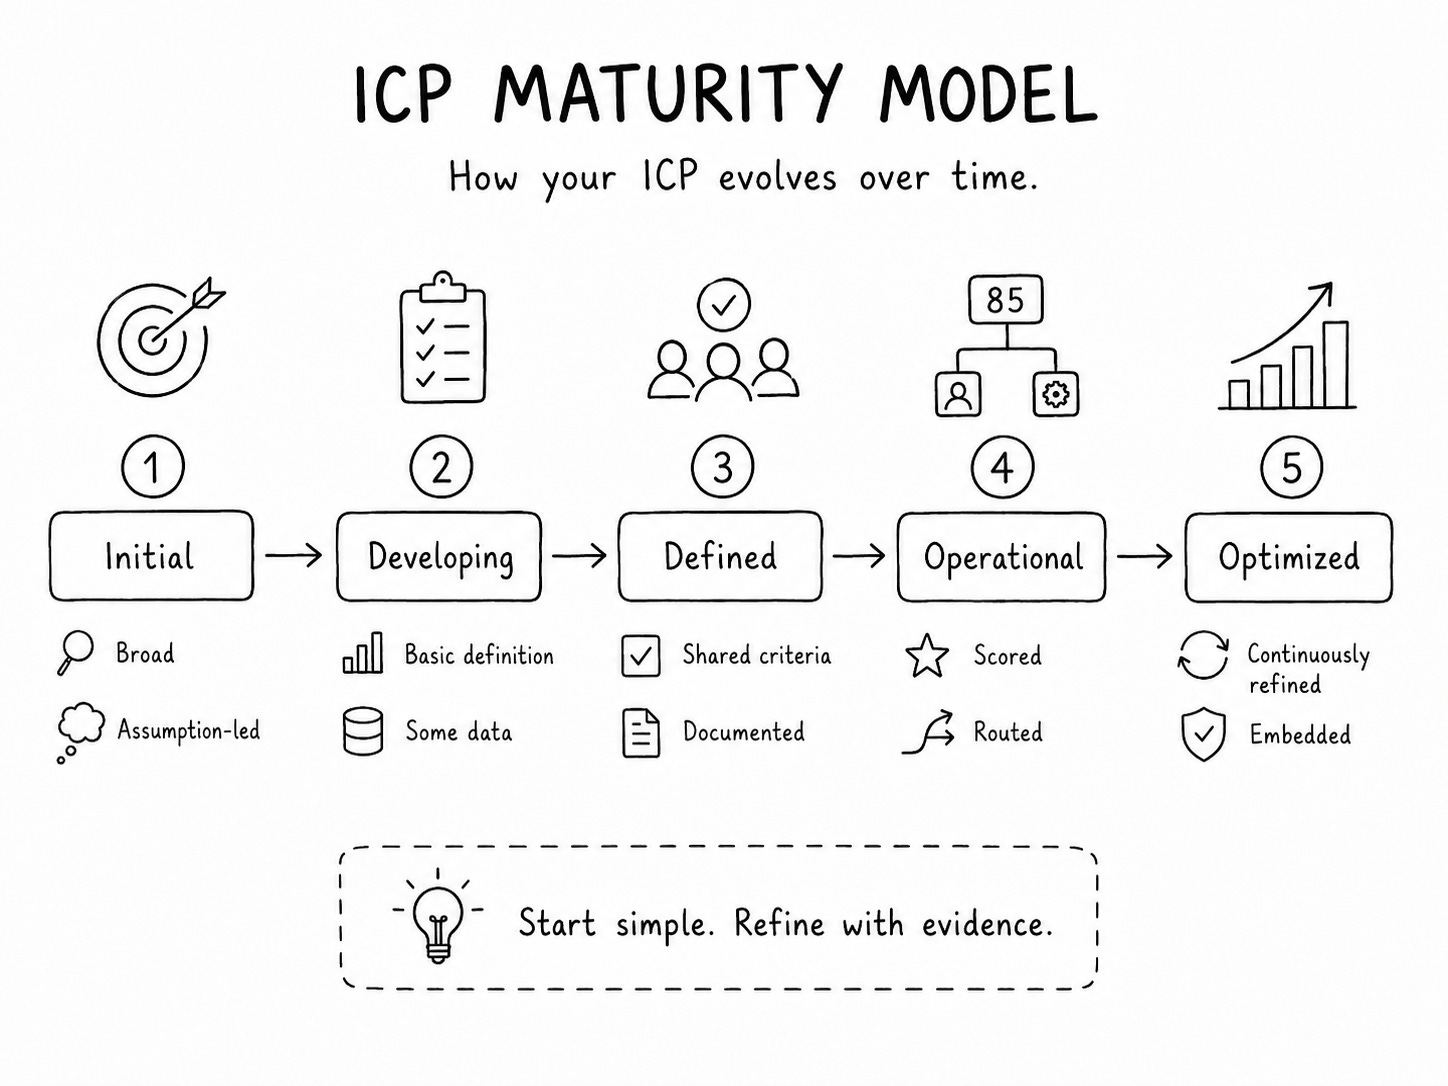
How should an ICP change by stage, and how often should you revisit it?
Pre-PMF: uncomfortably narrow. Paul Graham’s version is to satisfy “all the needs of a subset of potential users” rather than a subset of the needs of all of them. YC: “recruiting 10 customers who have a burning problem is much better than 1000 customers who have a passing annoyance.” Bessemer says to make it narrow “uncomfortably narrow, so narrow it almost feels too small,” to focus on one ICP at a time even when the product has broad applications, and to avoid targeting enterprises first. First Round’s Emery Rosansky sets the epistemics: “in the early days, you’re flying nearly blind with a small amount of data, so this initial ICP is not much more than an educated hypothesis.”
The obstacle at this stage is usually not ignorance. Clay’s Kareem Amin names it: “Often it’s not that you don’t know who the customer is, it’s that you’re not picking, you haven’t committed to one hypothesis over the other.” When Clay did narrow, it enforced the choice by cutting irrelevant features, removing non-tailored marketing language, updating internal docs and re-educating the team. Cadence here is event-driven, not calendar-driven.
Two findings from Rachitsky’s founder interviews pull in opposite directions. Most founders got their first ICP wrong, so the exercise is iteration rather than insight: Persona’s Rick Song ran it “17 times in the early days,” and Databricks had none at all, working with “a hospital that was using this stuff... folks that were using us to determine earthquake magnitudes using Twitter.”
Skipping the exercise can slow product-market fit. Mathilde Collin at Front: “We did not think about ICP. I wish we did earlier on. It’s one of my biggest mistakes.” Barry McCardel at Hex was forced into it by launch: “once we did our public launch, we started getting a flood of different people coming in. Filtering through the leads spurred me into putting a much tighter definition around qualification for deals.”
Series A/B: evidence-driven narrowing. a16z frames the stage “rapidly experimenting to refine your ideal customer profile and build repeatable sales motions.” Bessemer’s ARR ladder is the most specific guidance available: at $1-10M ARR, “aim to fulfill the product vision for your initial ideal customer profile,” sequencing product-market fit, then strong net retention in the ICP base, then broadening; at $10-25M, “it becomes important to start segmenting leads to the salespeople and sales teams who are best equipped to handle them”; at $25-50M, “crystallizing your ideal customer profile” becomes one of the most important tasks, and you finally have enough deals to find the pattern.
OpenView’s analytical method for this stage: “Pull all of your opportunities from the past year and clean the data. Look for the expected LTV per opportunity versus the CAC across different characteristics, such as industry, company size, buyer persona and use case.” With the caution that firmographics alone “does not drive any particularly important insights.”
Jason Lemkin puts numbers on when to split the team: begin segmenting “as early as 3 reps,” formalize three or four categories “after maybe $8m-$10m ARR.” Stripe added one segmentation dimension per year starting with size, and Jeanne DeWitt Grosser describes the failure mode: “You know you have a segmentation problem when the same account executive is talking to a million-dollar company in the morning and a billion-dollar company in the afternoon. Those sales processes have nothing to do with one another.” Cadence: a quarterly playbook review, and Mandy Cole’s instruction is to check it against reality: “Go through and see if it’s what you’re doing in the field, and if it’s not, update it to see the impact on pipeline.”
Enterprise: a new ICP, not an extension. Joe Morrissey at a16z warns against treating interest as fit: “the single biggest mistake I’ve seen companies make when moving upmarket is mistaking initial enterprise interest for product-market fit. Just because you have product-market fit for startups, SMBs, or mid-market customers does not mean you’ll automatically find product-market fit in the enterprise space.” Segment’s enterprise ICP was “larger enterprises that were B2C, multi-product, multi-brand, multi-subsidiary, and most importantly, data-literate,” narrowed further to those with “forward-thinking data champion buyers who were either decision-makers or could partner with a CMO to shape the decision criteria,” and it required outbound pipeline generation with 9-12 month cycles.
Budget for the new segment differently. Lemkin: “If you force your CAC in a new segment to hit the same ROI as your overall, blended CAC goals, you’ll never leave your core safe ICP,” so 80% of new customers should hit a sustainable CAC while the 20% in new segments “just try to barely break even,” with 24 months to converge.
At this size the data team becomes the reality check. Bessemer: “The data team will come in and identify the users who have high product engagement, retention, and reach, and in many cases, the attributes of this cohort of users will differ, at least somewhat, from an original conception of the ideal customer.” And a16z’s point about who holds the pieces: “You can’t define your ICP in a silo. RevOps has data. Product sees patterns. Sales hears objections. Marketing picks up signal. Success sees who churns and who expands.”
Review versus revision. The cadence argument resolves once you separate the two words. Review is checking evidence: monthly or quarterly against live closed-won data, which is what Anis Bennaceur at Attention.com means by “the teams compounding fastest are refreshing it off live closed-won data on a monthly or quarterly loop.” Revision is changing the operating definition, and it should be rare and trigger-based: a new product capability that changes who you can serve, retention, win rates, service costs or willingness to pay differing by segment, a move upmarket, or behavioral data diverging from the original conception.
The apparent disagreement in the sources resolves the same way. Daria Dovzhikova supports full rebuilds after major launches or funding rounds; Erik Miller warns “Don’t change the ICP every quarter; that creates whiplash for sales and marketing.” Both are right, about different words.
How the ICP shows up downstream: positioning, outbound, roadmap, board
A definition nothing enforces isn’t a definition.
Positioning. April Dunford defines positioning “how your product is a leader at delivering something that a well-defined set of customers cares a lot about,” and the order of her five components is the argument for where the ICP sits: competitive alternatives (”what would customers do if our solution didn’t exist?”), differentiated capabilities, value, then target customer segmentation, then market category. The ICP is derived from unique value rather than assumed before it, because “your best-fit target customers are customers that really care a lot about your unique value.” Starting from market category is “the tail wagging the dog.”
The payoff, in her words: “Customers that are well suited for your offering will easily understand your value, will purchase faster, and are much less likely to ask for discounts.” The canonical case is repositioning a general enterprise CRM, which invited comparison with Siebel, as a CRM for investment banks where modeling interpersonal relationships was mission-critical: “from under $2M to close to $80M” in 18 months.
Demand generation. Chris Walker’s paid-social targeting formula is just “(1) Job Title + (2) Company firmographics (named accounts, company size, industry),” with the classic errors being no job-title targeting, no firmographic layer, and LinkedIn audience expansion that makes you “pay high CPMs to people you don’t want to reach.” Refine Labs allocates 60-70% of paid media to demand creation and about 30% to capture.
Budget for the measurement gap while you’re at it. Across 620 declared-intent conversions and $21.5M in closed-won ARR, Refine Labs found a 90% gap between software attribution and first-party self-reported data: podcast was credited with 53% of revenue self-reported and 0% by software.
Three worked outcomes. Clari moved to target account lists, persona alignment and zero-click content instead of lead-gen forms: ad spend down 38%, cost per SQO down 36%, acquisition cost down 67%, win rates up 64%. Loxo built priority account lists with buyer-count exclusions and ICP-focused content: acquisition cost down 23%, ARR up 45% quarter over quarter. Zappi analyzed region, industry and persona out of the CRM and targeted by job function: 3× average deal size and 7× qualified pipeline against spend.
Outbound. Clay’s method is the ICP definition and the list build in one motion: “Pull the deals that closed fast, stayed, and expanded, and ask what they had in common the quarter before they bought. The patterns that repeat are your ICP. Write the definition down as a list of filters you can source against later, split into firmographic (size, industry, geography), technographic (the tools they run), and signal-based (funding, hiring, expansion).”
Apply disqualifiers before list export since “disqualifiers applied after export waste enrichment credits and create compliance risk.” The workflow most teams end up with: build criteria in Sales Navigator, export, run through Apollo or ZoomInfo for contact data, layer Crunchbase for funding, overlay BuiltWith for technographics, process through Clay for dedup and scoring. With one caveat worth pinning up: “Company headcount is the least reliable filter in Sales Navigator. Many companies mischaracterize their size or list no headcount at all.”
Content. The operating chain is ICP and account fit, then priority personas and buying situations, then topic pillars, then stage-appropriate formats, then channels. Every campaign, product and content strategy should align to at least one persona, built on “motivations, goals, pain points, and language, not only demographics.” Exit Five’s practical step is the one teams skip: “Create a One-Pager: Summarize your ICP in one clear document that your entire team can use.” For volume calibration, 47% of buyers view three to five pieces of content before talking to a rep.
Roadmap. The ICP “should be a formal input into quarterly roadmap reviews, not just a Marketing document.” A segment-weighted score makes the tradeoff explicit: revenue × strategic fit × growth signal × usage depth. Worked: a $30K mid-market account that is a core ICP match, expanding, and a power user scores 108; a $100K enterprise outlier that is contracting and lightly used scores 5, making “the mid-market account’s feedback 21x more valuable for prioritization purposes.” The counterweight keeps it honest: over-indexing on power users “harms the product experience for the rest of the user base, and steals product effort away from features that could go towards acquiring new users.”
Board reporting. a16z flags Net New Weighted Pipeline as the leading indicator of market pull. Pair each metric with the decision it drove, since 70% of a board meeting should focus on the future and the issues at hand. First Round’s Vanta example is the model: a 6% win rate on one product-buyer combination where “generally, a win rate below 30% means salespeople are wasting time and you need an unsustainable amount of pipeline. In this case, the solution wasn’t to fix sales, but to immediately stop selling this product to this buyer.” And SaaStr’s observed NRR gradient by deal size makes the segment story concrete: single-seat deals under $99/month at roughly 3% monthly churn, $99-$999 at about 100% NRR, $10K-$100K+ at about 120%.
Why do ICPs fail?
Fullcast and Pavilion’s 2026 GTM benchmark found ICP misalignment cuts win rates by up to 75%, and that 63% of 118 CROs had little or no confidence in their own ICP. Nobody in that survey is missing a document. They just don’t believe theirs.
Nine failure modes, in the order I’d expect to hit them rather than the order they’re usually listed.
Written but not operationalized. The pattern: “ICP alignment is not a strategy doc... You defined your ICP in a slide deck three quarters ago. But you haven’t updated routing rules since.” Owner.com’s CRO Kyle Norton found “either bad or no targeting on prospects,” poor-fit closes and mis-set expectations, with churn a “massive drag on efficiency” in his first 90 days; his fix was to pause the Growth plan, say no to a lot of customers, and build a lead quality system. Remedy: audit the top 50 closed-won deals against current scoring and routing rules. Figma’s version was to segment sales at the 1,000-employee line and pipe product usage into Salesforce via reverse ETL.
Static. One RevOps lead describes a client that “re-wrote their ICP properly last year, negative criteria and all, then left the old scoring weights and routing rules untouched for two quarters. The doc said one thing, the system kept qualifying the drifted accounts, and nobody reconciled the two until win rate forced it,” calling drift a “silent revenue killer manifesting as declining win rates, lengthening sales cycles, and churn concentration.” Lemkin’s line: “an annual ICP exercise is a 2021 habit.” Remedy: treat it as a living hypothesis with a monthly closed-won review. One founder who did that cut outbound from 2,000 to 400 emails a month while win rate rose from ~3% to 11%.
Aspirational. The written ICP describes the customer the company wants; closed-won describes the one it has. The cost: “The gap between those two is where marketing spend goes to die,” with an SDR team hitting an 11% win rate and a 178-day cycle against the written ICP. Sometimes the gap is a level, not a segment: First Round documents a company that “thought they were selling to CISOs at early- and growth-stage orgs, but realized through user research discussions that the people that acutely felt the pain were 2-3 levels below a CISO in an Enterprise org.” Remedy: start from 18-24 months of closed-won, and note Rachitsky’s finding that data from outbound sales beats leads from investors and friends as a signal.
Too broad. Cascade’s Jake Fuentes defined “nontechnical business analysts using Excel to crunch big data sets,” later calling it “much too broad” and describing the result as ICP fray: a scooter company managing location data, an HR team and a retailer under one profile. “To know what problem you’re solving, you need to know who you’re solving it for.” Remedy: replace generic firmographics with operational signals, and start from about three distinctive attributes.
Demographics instead of behavior and situation. A profile of static firmographics with nothing distinguishing accounts likely to buy now. Remedy: convert filters into real-time signals, and mine what you already own. Lemkin: prospect call transcripts are “the highest-signal first-party data your company will ever own.”
No negative ICP. No-decision deals “can account for up to 40% of a pipeline,” which is exactly what disqualifiers are for. Remedy: Mandy Cole’s Green/Yellow/Red: green is proactive pursuit, yellow is inbound and referral only, red is no-go.
No discipline at close. Quota pressure closes poor-fit deals. Katrina Wong separates an ICP from inbound demand: an ICP is a choice about “who you want to sell to versus who just wants to buy from you.” Clay’s co-founder Varun Anand gives the honest version of what discipline costs: “We had few true customers because almost none of the existing ones fit our new ICP,” and after narrowing to outbound sales, “nearly all of our original customers churned.”
Confusing ICP with persona. Remedy: keep the split clean: “ICP answers ‘what kind of company should we go after.’ Persona answers ‘who inside that company makes the call.’” Qualify the account first, then map the committee.
Trusting CRM loss reasons. 15% buyer-seller alignment, 70% competitor mismatch, 98% inconsistent tracking, all cited above. Remedy: 20 interviews within a segment before concluding anything.
The single best test of whether yours is real: an SDR can identify or disqualify an account quickly, marketing can target it, RevOps can score and route it, and sales can explain why it should be pursued now. If any of the four can’t, it’s a point of view rather than an ICP.
Where the practice is heading
The ICP-as-PDF is explicitly retired in current practice. iCustomer, July 2025: “The traditional definition of an Ideal Customer Profile as a static document describing your perfect customer is obsolete. In 2025, an ICP isn’t a document, it’s a dynamic, data-driven automated system that evolves in real-time based on live signals and market intelligence.”
Tooling now derives the profile directly. ZoomInfo’s AI-Generated ICP takes a CRM report of won and lost deals and learns which attributes indicate best targets, refreshing as conditions change. HG Insights’ Market Analyzer Copilot builds ICPs from win/loss, firmographic and technographic data correlated with highest-CLV customers.
The capability gap is the more interesting number. Enlyft found 81% of respondents likely to update their ICP in 2024, yet nearly 70% lacked a strong grasp of account scoring and 43% had invested in scoring without understanding its efficacy. The differentiator is not access to a model. It’s knowing what a good one looks like.
Further reading
Lenny Rachitsky, How to identify your ideal customer profile. The operator counterpart to this page, and the best collection of initial ICPs anywhere: a nine-item attribute picker, a dozen founder accounts, and the three-attribute floor. It paywalls at the template and the comparison chart.
a16z, a framework to define and refine your ICP, for the nine-field template and the revision triggers.
First Round Review, the most common go-to-market questions from founders, which is where the hiring-signal example and the “educated hypothesis” framing come from.
April Dunford, a quickstart guide to positioning, for why the ICP comes after differentiated value rather than before it.
Full Funnel’s ICP for ABM, which publishes an actual Google Sheet.
Allston Labs on closed-won deconstruction, the most rigorous small-sample method I found.
Clozd on building a win-loss program, for the interview thresholds and why CRM loss reasons mislead.
Clay’s account of what narrowing costs, which is the least comfortable line in the whole set: after they narrowed, “nearly all of our original customers churned.”
FAQ
What is an ideal customer profile? An account-level definition of which companies you are best at winning, serving, retaining and expanding, expressed as scored criteria and explicit disqualifiers rather than prose. It answers four questions: who will buy, who will buy smoothly, who can be implemented and serviced, and who will renew and expand.
How is an ICP different from a buyer persona? The ICP is the company, the persona is the person inside it. Qualify the account first, then map the buying committee. Treating them as synonyms produces a profile that can’t be used for routing or list building.
How is an ICP different from TAM? TAM is a dollar-value estimate of the whole opportunity. An ICP is a qualitative definition of which account types fit best. Every ICP account sits inside your TAM; most TAM accounts are not in your ICP.
How many customers do you need before you can define one? 5-7 closed-won deals support a provisional hypothesis, 30 is a stronger first pass, and 50 combined won and lost supports general pattern analysis. Below that, use the top 3 by revenue and top 3 by retention as a quarterly-revised hypothesis, with closed-lost as the control group.
How many attributes should an ICP have? Four to seven, and at least three. Past 8-10 dimensions you are over-specified and fitting noise, and the profile stops being usable by an SDR in real time.
How often should you update an ICP? Review monthly or quarterly against live closed-won data. Revise the operating definition only on a trigger: a new capability that changes who you can serve, retention or unit economics splitting by segment, a move upmarket, or behavioral data diverging from the original conception. Rewriting it every quarter creates whiplash in sales and marketing.
Who owns the ICP? One named owner with a change log, usually RevOps or whoever manages the CRM and the go-to-market cadence, with input from product, sales, marketing and customer success. At the earliest stage it belongs to the founders, because it is still being discovered in customer conversations.
Do you need a negative ICP? Yes, as its own section rather than the inverse of the positive criteria. Split hard exclusions you never target from soft ones you serve on inbound and referral only, and conditional ones a trigger can override. No-decision deals can reach 40% of a pipeline, and disqualifiers are what protect it.
Where should the ICP document live? Two places. A shared doc for the narrative version, and the CRM for the enforced version, as a fit score and a tier on the company object. If it only exists in the doc, it isn’t operating.
What is the difference between fit and intent? Fit is whether a company should buy from you, from stable attributes. Intent is whether it is looking right now, from recent signals. Score them separately and combine at routing: fit sets eligibility, intent and timing set the tier.
How do you know the ICP is working? Track ICP share of pipeline by count and dollars, win rate by tier, deal velocity by tier, and renewal rate by tier. If Tier 1 doesn’t convert materially better than Tier 3, the tiers are decorative.